Thanks to Jamie, Peter and Ek for having me on XM to discuss and debate some of the points that I wrote about on Friday. I wanted to repost for those who didn't get a chance to read..
Here's something else to think about as you review the numbers. While the cap has gone up 29% since 2005, the floor has actually increased 60%, which has really hurt the teams in weaker markets.
Cap (mil)
2005-06 $39.0
2006-07 $44.0 12.82%
2007-08 $50.3 14.32% 28.97%
Floor (mil)
2005-06 $21.5
2006-07 $28.0 30.23%
2007-08 $34.3 22.50% 59.53%
It's worth noting that before the lockout, ten teams spent less than $34.3 mil on payroll and five of those teams were under $30 mil (Nashville was the lowest at $23.2 mil).
I'll be at the Legends Game tomorrow and the Hall of Fame press conference and induction on Monday so I expect to have some really great material for this week. If you guys have any questions for any of the Legends, let me know and I'll do my best to get them answered for you.
Enjoy the games tonight..
D.
**************
"Frankly all of this is about the fans" - 3 Years Later
"With the right economic system, we can have 30 healthy, competitive franchises all with affordable ticket prices, which frankly all of this is about the fans. All of this is making sure that our game is as healthy as it can be. " - Gary Bettman, September 22, 2004
"Before we can open our arenas, we need to fix the economic system under which our sport operates. We'll be back as soon as the players' Union is prepared to talk to us about a partnership that allows us to offer all NHL fans affordable tickets prices and 30 stable and competitive franchises." - Gary Bettman, October 13, 2004
"We believe that a partnership is critical for the future of our game. A partnership will ensure 30 healthy and competitive franchises with affordable ticket prices. This is a goal that we will not abandon." - Gary Bettman, October 13, 2004
30 healthy and stable franchises.
Affordable ticket prices.
Frankly all of this is about the fans.
Three years has passed and it's still difficult for me to move past these blatant lies.
If those really were the actual goals of the lockout, we should be into the fourth season without hockey while the Commissioner tries to come up with a system that makes franchises in Atlanta, Nashville and Phoenix healthy and stable.
Over the summer I promised a look at the overall health of the league and while I've done a lot of reading and research on the topic (even trying to reconstruct the Levitt Report using current data), I hadn't gotten the chance to revisit this topic. The Forbes numbers are in for the year and while they always need to be reviewed with an analytical eye because they're not 100% accurate, when used in conjunction with other facts that have been reported some conclusions can be drawn.
Keep in mind that the league traditionally has stated that Forbes' numbers don't accurately portray how poor the league is doing. For example, when the league was claiming losses of $273 million in the year before the lockout, Forbes had those losses pegged at $96 million.
So let's look at the numbers..
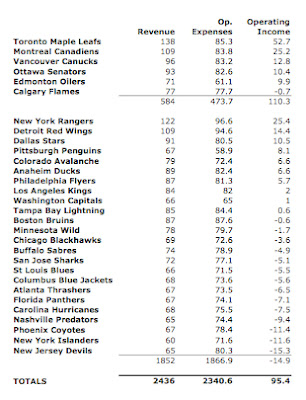
Forbes states that the league has gone from an operating loss of $96 million pre-lockout to a profit of $96 million this season. When broken down into detail:
$130.5 mil combined profit, Top 5 Teams (avg $26.1 mil/team)
$57.8 mil combined profit, Next 7 Teams (avg $8.3 mil/team)
($92.9 mil) combined loss, Bottom 18 Teams (avg - $5.2 mil/team)
Or,
$110.3 mil combined profit, Canadian Teams (avg $18.4 mil/team)
($14.9 mil) combined losses, American Teams (avg - $0.6 mil/team)
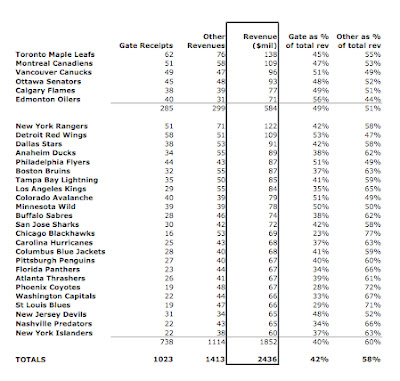
Looking at revenues, there are eight teams that earned $25 million or less in gate receipts for the year (Carolina $25 mil, Florida $23 mil, Nashville $22 mil, NY Islanders $22 mil, Washington $22 mil, Phoenix $19 mil, St. Louis $19 mil, and Chicago $16 mil), while Toronto, Detroit, Montreal and NY Rangers were over $50 mil.
The Leafs and Rangers made over $70 million in non-gate revenues while the Flyers, Avs, Devils, Wild, Sharks, Canes, Pens, Blue Jackets, Islanders, and Thrashers were at or around $40 mil.
The disparity in overall revenues (after profit sharing) is staggering:
4 - over $100 mil (Tor, NYR, Det, Mon)
3 - $90 - $99 mil (Van, Ott, Dal)
5 - $80 - $89 mil (Ana, Phi, Bos, TB, LA)
6 - $70 - $79 mil (Cal, Edm, Col, Min, SJ, Buf)
12 - $60 - $69 mil
The average club revenue is $81.2 mil according to their stats, but only 12 teams are above that average, even after revenue sharing.
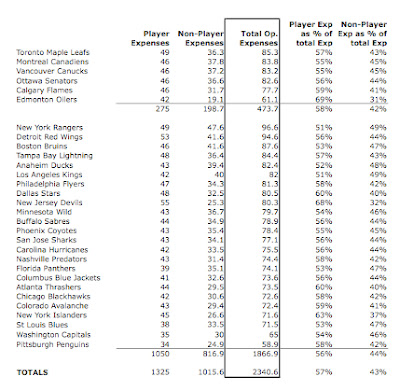
On the expense side this is the area that was most impacted by the lockout. Not the total amount, just the distribution of wages. Now the poorer teams must pay more and the richer teams are forced to pay less. In theory this should lead to parity over the long-term although the greatest ramification is that as the cap continues to rise due to the strengthening Canadian dollar and growing revenues in strong markets, the weak teams will be forced to increase their payrolls even further.
Looking at non-player expenses (team operating and development costs, arena and building costs, general & admin and advertising, PR & marketing), the Oilers are listed at $19.1 mil which seems extremely low. Only five other teams are under $30 mil and the Rangers are at the top, paying out $47.6 mil in expenses. According to the data, teams pay out 43% of their total expenses in non-player costs (was 34% in the Levitt report). This is where a team can truly try to build a competitive advantage through coaches, facilities, scouts, equipment, etc. Leaf fans would be disappointed to find their team near the middle of the pack at $36.3 mil.
Total expenses range from $58.9 mil (Pittsburgh) to $96.6 mil (NY Rangers).
Some thoughts on their numbers..
1. Their total revenue $2.436 bil, while it's been widely reported that total HRR for the year was $2.326 bil. Their gate receipt number for the most part are not far off from those released by the Globe and Mail last season and player expenses are publicly available which should make those numbers quite accurate. Thus revenues are overstated by 4.7%
2. Player expenses totaled $1.325 bil, which comes to 54.4% of their total stated revenue. However, at $2.436 bil, the players' share should actually be 56.12%. At $2.436 billion, the players' portion was 55.6%, or $1.293 billion. Player expenses appear to be overstated by 2.5%.
3. I think some of the 'other revenue' numbers may be inflated. I have a hard time believing that the Hawks only earn $16 mil in gate receipts ($390k/game), but they make $53 mil a year in other revenue. If true that would mean that just 22% of the team's revenue comes from tickets sold, which is very odd in a league where revenues are heavily gate-driven.
4. If true that 'other expenses' have grown 31% since the lockout that would be extremely high. It would be impressive if they spent that money to help grow the game instead of spending funds to advertise during hockey games that Sidney Crosby isn't going to play for the name on the back of his sweater. If the number is accurate and the increased spending was an investment, it clearly hasn't paid off.
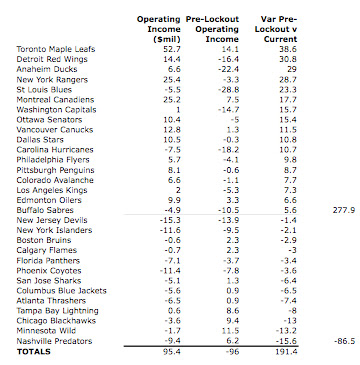
If you compare the current Forbes numbers with those released prior to the lockout, that's where things get interesting.
While the league on a whole is in a better financial position, thirteen teams are less profitable or losing more than they were before the lockout.
THIRTEEN TEAMS.
But the rich have certainly gotten much richer:
 Frankly all of this is about the fans.
Ticket prices are as high as ever.
National coverage in the US is non-existant.
Teams are playing in half-empty buildings.
Markets are not all healthy and not stable. Not by a long shot.
Salaries are back to pre-lockout levels, albeit linked to revenues that may have been previously understated.
Once-proud and successful franchises like Chicago, Boston and New York (Islanders) have struggled on and off the ice for many years now.
Small market teams are receiving funds through revenue sharing, but their payrolls vastly exceed those from the pre-cap days (ie Florida - $26.4 mil in 2003-04, $45 mil+ in 2007-08).
Fans in certain markets are dying for a team but can't get one. Fans in others could care less but their city has or is likely to get one.
The sky isn't falling but the league could be in much, much, MUCH better shape.
Frankly all of this is about the fans.
Three years later and it still makes me sick.
Danny -
[email protected] 


 Join the Discussion:
»
Join the Discussion:
»