
One of the trickier things I think with Olympic competitions is the fact that, in what's more or less a single-game elimination with a glorified pre-knockout group play stage, just about anything can happen. The big four -- Russia, Canada, the United States, and Sweden -- are mathematically very probable to advance in any instance where they draw one of the bottom four. And, even the middle tier of teams, they're much more likely than not to win.
But, hockey's hockey. One goaltender can steal the show over sixty minutes. One run of lucky bounces can send a team home early. There aren't any guarantees in a format like this, only the consolation that if you bring the better team, you're probably going to win.
I've sort of been playing around with estimates as to the ability of each team to carry possession and drive play. Now, again, that's just one part of the sport. Russia's loaded with high percentage shooters. Sweden and Finland have fantastic goaltending. A team like the United States might carry one of the best penalty kills. Canada's going to carry the best or second best of just about everything.
It's sort of tricky considering how many teams in the competition are carrying non-NHL players, but more or less what I did here was parse all of the Relative Corsi% from various sites for each player for the 2014 season. Reminder: Relative Corsi% is just the difference in Corsi between a player's on-ice performance and his team's performance when he's on the bench. So, a guy like Patrice Bergeron, for example, is a major plus.
So, the compiling part was easy. What's unfortunate is that for a lot of the non-NHL'ers, I more or less had to provide some sort of guesstimate as to what their Relative Corsi% would be if they played as a regular on an NHL team. I settled with the replacement level percentage, which is obviously a fairly big negative. The lone exception to this rule was Ilya Kovalchuk, who is clearly an elite talent that's overseas for personal reasons. For the most part I think it's pretty fair, though I think you can find a few instances on each side where a player is measurably better or worse than his estimated number (e.g. Radulov).
Here's the graph, anyhow (expanded here):
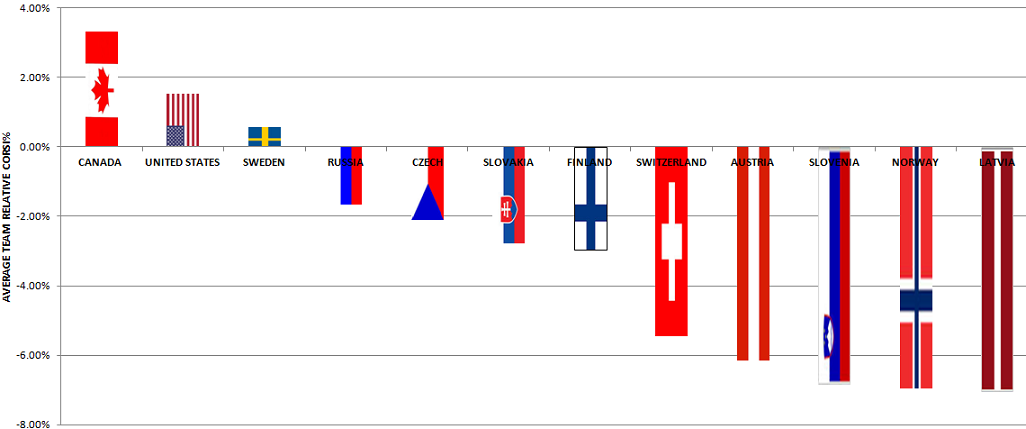

Just to clarify: your average NHL'er on Canada is three and a half percentage points better than his team's average at driving the play. This is quite good.
For your teams loaded with NHL'ers -- the big six, I should say -- the estimates for non-NHL'ers won't matter too much. It's not surprising to see Canada, the United States, and Sweden in the top-three -- Russia at four, with or without the replacement level estimates, makes sense to me. Their high-end talent away from Datsyuk and Malkin aren't necessarily otherworldly at owning the shot-battle, but they are otherworldly at shooting the puck to holy hell.
If there's one thing I think this illustrates, it's that the gap between the Czechs/Finns and Swiss may be bigger than one thinks. To me, this makes some intuitive sense. I see the Czechs as much bigger threats to Russia (or, whichever medal hopeful) than I do the Swiss, because their team collectively is teeming with much more NHl caliber talent.
Anyways, fun little project to prepare for tomorrow's openers. Enjoy the games. I'm back tomorrow with a preview for Russia's opener against Slovenia.
Thanks for reading!