Five Metropolitan Division teams are still in the playoff race. Below, we take a look at each of their schedules, and based on opponents, rank each team’s schedule on difficulty at the end of the article.
*NOTE: Home and Road games are not taken into account when assessing schedule difficulty. Only opponent difficulty is used, calculated by point total divided by games played.*
NYI
Game 71: @ DET: 58 points/71 games= 0.82
Game 72: @ MIN: 74 points/71 games= 1.04
Game 73: vs BOS: 93 points/71 games= 1.31
Game 74: @ MTL: 81 points/71 games= 1.14
Game 75: @ PHI: 76 points/70 games= 1.09
Game 76: vs ARI: 77 points/71 games= 1.08
Game 77: @ CBJ: 81 points/70 games= 1.16
Game 78: @ WPG: 86 points/70 games= 1.23
Game 79: vs BUF: 69 points/70 games= 0.99
Game 80: vs TOR: 89 points/70 games= 1.27
Game 81: @ FLA: 74 points/70 games= 1.06
Game 82: @ WSH: 91 points/71 games= 1.28
Average of 1.1225 Difficulty (13.47 Total/12 games)
NOTES
Despite a fairly easy schedule, the Islanders will play eight of their last 12 games on the road.
WSH
Game 72: @ TBL: 112 points/71 games= 1.58
Game 73: @ NJD: 61 points/71 games= 0.86
Game 74: vs TBL: 112 points/71 games= 1.58
Game 75: vs MIN: 74 points/71 games= 1.04
Game 76 vs PHI: 76 points/70 games= 1.09
Game 77: vs CAR: 83 points/69 games= 1.20
Game 78: @ CAR: 83 points/69 games= 1.20
Game 79: @ TBL: 112 points/71 games= 1.58
Game 80: @ FLA: 74 points/70 games= 1.06
Game 81: vs MTL: 81 points/71 games= 1.14
Game 82: vs NYI: 89 points/70 games= 1.27
Average of 1.2364 Difficulty (13.60 Total/11 games)
NOTES
Washington has a very tough schedule. Three of their last 11 games will be against Tampa Bay. Only four of their games come against teams with a difficulty of less than 1.14. The Capitals will play six home games and five road games.
PIT
Game 72: vs STL: 79 points/70 games= 1.13
Game 73: vs PHI: 76 points/70 games= 1.09
Game 74: @ CAR: 83 points/69 games= 1.20
Game 75: @ NSH: 85 points/72 games= 1.18
Game 76: @ DAL: 79 points/70 games= 1.13
Game 77: @ NYR: 69 points/70 games= 0.99
Game 78: vs NSH: 85 points/72 games= 1.18
Game 79: vs CAR: 83 points/69 games= 1.20
Game 80: @ DET: 58 points/71 games= 0.82
Game 81: vs DET: 58 points/71 games= 0.82
Game 82: vs NYR: 69 points/70 games= 0.99
Average of 1.0664 Difficulty (11.73 Total/11 games)
NOTES
Pittsburgh has the easiest schedule by far. They play two games against Detroit and two games against the New York Rangers. Their highest opponent difficulty is Carolina at just 1.20. Pittsburgh will play six home games and five road games.
CAR
Game 70: @ CBJ: 81 points/70 games= 1.16
Game 71: vs BUF: 69 points/70 games= 0.99
Game 72: vs PIT: 87 points/71 games= 1.23
Game 73: vs TBL: 112 points/71 games= 1.58
Game 74: vs MIN 74 points/71 games= 1.04
Game 75: vs MTL 81 points/71 games= 1.14
Game 76: @ WSH 91 points/71 games= 1.28
Game 77: vs WSH 91 points/71 games= 1.28
Game 78: vs PHI 76 points/70 games= 1.09
Game 79: @ PIT 87 points/71 games= 1.23
Game 80: @ TOR 89 points/70 games= 1.27
Game 81: vs NJD 61 points/71 games= 0.86
Game 82: @ PHI 76 points/70 games= 1.09
Average of 1.1723 Difficulty (15.24 Total/13 games)
NOTES
Carolina has a fairly tough schedule. The Hurricanes play Tampa Bay, Toronto, Washington twice and Pittsburgh twice. That being said, eight of their final 13 games will be played at home.
CBJ
Game 71: vs CAR 83 points/69 games= 1.20
Game 72: @ BOS 93 points/71 games= 1.31
Game 73: @ CGY 93 points/70 games= 1.33
Game 74: @ EDM 69 points/70 games= 0.99
Game 75: @ VAN 67 points/70 games= 0.96
Game 76: vs NYI 89 points/70 games= 1.27
Game 77: vs MTL 81 points/71 games= 1.14
Game 78: @ NSH 85 points/72 games= 1.18
Game 79: @ BUF 69 points/70 games= 0.99
Game 80: vs BOS 93 points/71 games= 1.31
Game 81: @ NYR 69 points/70 games= 0.99
Game 82: @ OTT 54 points/71 games= 0.76
Average of 1.1192 Difficulty (13.43/12)
NOTES
Columbus has three tough games lined up against Carolina, Boston and Calgary. In their final nine games however, five will be against teams below a 1.00 difficulty. Only four of their final 12 games will be played at home.
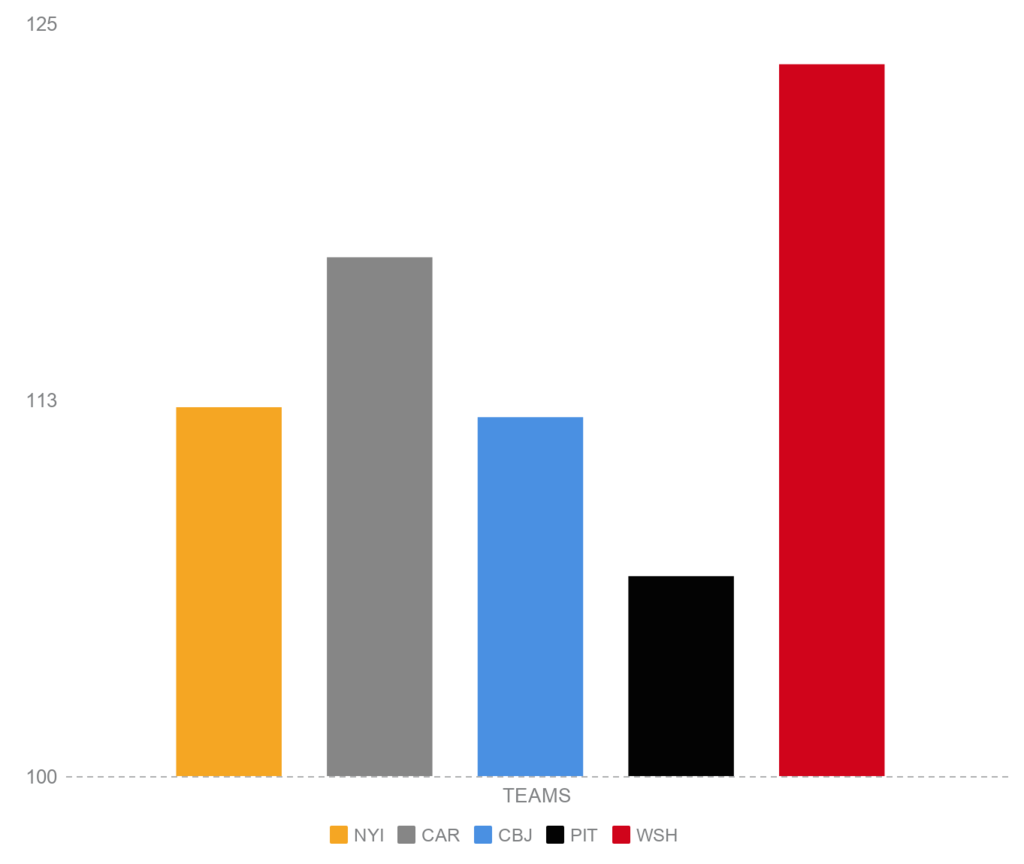
Below is a graph just to compare the schedule difficulty.
*Note: All difficulties have been multiplied by 100 for the purpose of the graph.*

*Graph powered by Piktochart*


 Join the Discussion:
»
Join the Discussion:
»