
Follow me on twitter for news and notes about the Kings and the NHL
It is simple. They lost more shootouts and overtime games. Jason, stop, it is that easy. There really was no difference!
Alright, the prevailing logic seems to be that, and it seems to have merit to a certain degree. There is also merit in saying that the Kings faced a few teams who played much much better down the stretch this season versus previous seasons. A little bit of bad fortune and a lack of finish in extra periods of play was the difference. Yea, sounds about right.
That, however, is far too easy. Where would we be as investigative minds and people if we just took that for its word and sat back?
Now we do not want to obviously make something out of nothing by pulling every possible number out of our behinds and saying "This! This right here is way different from previous years! AHA! Found it!" That would be somewhat frivolous. There are, however, certain key numbers worth checking when you want to make sure everything is pretty much in order.
One of these numbers, which we have not talked about much on this blog, is Fenwick Close. Brace yourself, yes, more fancy stats! Hey, if you do not like those fancy stats we did recently post a Top 10 goals of the season! Pop on over and check that out right here. Otherwise, embrace your inner nerd and let's adventure into the Fenwick Close numbers of the past few seasons.
First off, Fenwick is just like Corsi except for one difference: Where Corsi counts blocked shots as part of the equation, Fenwick eliminates them. Let us be honest, shot blocking can be a real skill, and Corsi in some way can not properly reward good shot blockers. It can also, on the flipside, reward forwards who constantly get their shots blocked rather than on net. All the "Close" portion of this means is when the score is either tied or within one goal either down or up. This somewhat helps mitigate score effects and blow out games, where teams have either shelled up defensively or completely given up in general. In short, Fenwick Close is unblocked shot attempts when the score is tied or within 1.
Got it? Got it.
FenClose seems to be a good indicator for us when valuing contributions of key players. It puts an emphasis on possession in competitive games. You have probably seen Sutter, in numerous games that are out of reach, play the fourth line and his bottom pairing an almost excessive amount. Likewise, with tight games he can sometimes staple young struggling players to the bench. For good reason as well.
In 2014-15 the Kings FenClose numbers go roughly as you would expect. The good players turn up in the good spots, and the notably struggling players turn up in the expected spots. The Kings top-5 FenClose on the ice vs. off the ice (Rel%) contributors are as follows:
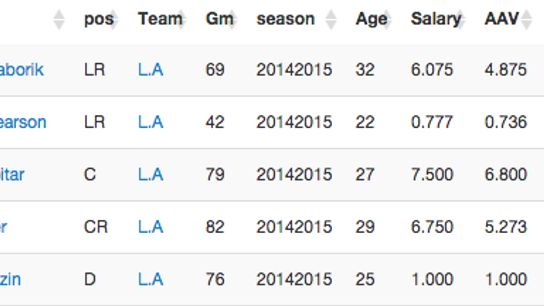
Table by War-on-Ice.com
Yes, in case you were wondering, Toffoli is sixth. Also, look at that, Jake Muzzin is top-5 in another statistical category.

The bottom five? I bet you could guess them without even seeing it:
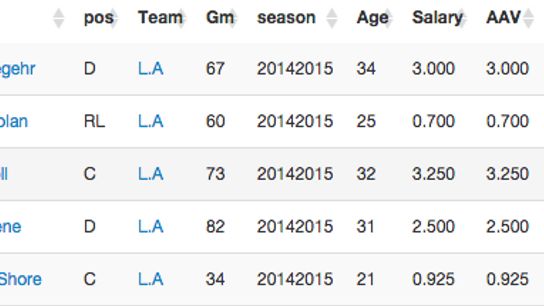
No real surprises there either.
The best thing about the Kings though, and this has always been a strength, is they have very few true liabilities up and down the lineup. Almost every player wins the Fenwick close battle (+50%). The five players that don't are the same five players that populate the bottom five in relative on vs. off: Greene, Stoll, Regehr, Shore, and Nolan. Every other player on the team, at least in 2014-15, won the Fenwick battle in close games. Want to be thoroughly frustrated? Just take a look at Calgary's player scores in close games. It is maddening. Where as the Kings had five players under 50-percent barrier, the Flames had an unsightly 15 of 23 eligible skaters losing the close game possession battle. Even the Ducks, who are cruising through the playoffs at this point, have nine players on the roster whom you could consider liabilities in close situations when the games matter.
So where are the subtle differences when it comes to this year's squad versus last year? A team that missed the playoffs versus a team that made it SEMI-comfortably.
Well, they actually aren't that subtle at all!
First off, the Kings only had four players sub-50, three if you omit Linden Vey. Regehr, Mitchell, and Lewis.
Now here comes the surprising stuff: The upper echelon.
The Kings of 2013-14 dominated when it came to close games. They had a startling nine players (10 if you want to count Dan Carcillo) in a range of 58% FenClose and up. Six of those ten were clear of the 60% marker.
2013-14 Fenwick For Close
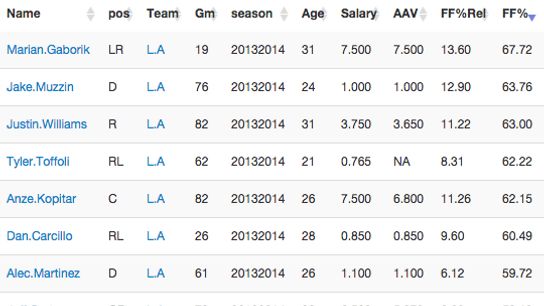
In 2014-15 it was much much different. Be it by virtue of teams playing the Kings tighter, or L.A. just simply not having the quality, the numbers were far less convincing in close games.
Only one player broke the 60% barrier and that was Marian Gaborik. Only two broke the 58+ barrier, Gaborik and Jamie McBain. Overall, the top 10 players in FenClose for the Kings were just simply not as good as 2013-14.
2014-15 Fenwick For Close
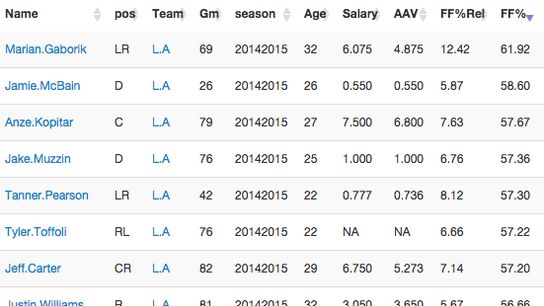
This is reflected quite clearly in their questions 2014-15 one-goal game record, which stood at 13-9-15. Compare that to last season's 21-14-8 record. While not extraordinarily different, the 2013-14 record was notably better and it made a big difference.
For posterity, 2012-13 was similarly as good as 2013-14.
2012-13 Fenwick For Close
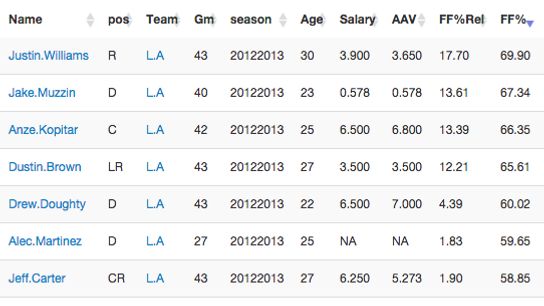
And 2011-12 was also quite good, but more akin to 2014-15. Even then it is a little bit better. Those two seasons are almost identical to each other overall except in 2011-12 the Kings made the playoffs and in 2014-15, well, they did not.
2011-12 Fenwick For Close
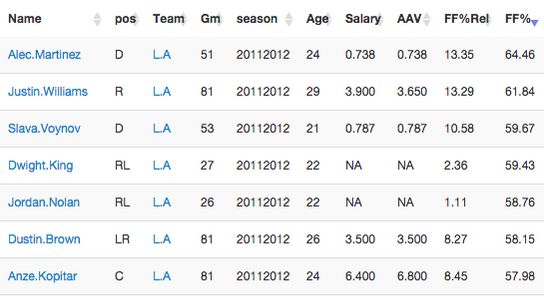
Again, these numbers vary heavily going team to team. The Ducks for example, have always been good in one goal games and have not been the strongest of possession players. Likewise with Calgary this season. However, if you are looking at comparative year's within the team, that is when we can start maybe drawing conclusions or presenting theories.
Stated ad nauseum at this point, luck and competition played a large factor in the Kings losing out this season versus previous seasons. However, the one goal game record cannot simply be written off to luck when you look at how much less the Kings top players had the puck and were productive with it versus previous years.
All tables by War-on-Ice.com
++++I AM CURRENTLY LOOKING FOR ADVERTISERS! If you, or anyone you know would be interested in placing an ad on the blog here at HockeyBuzz then send me a PM!+++++